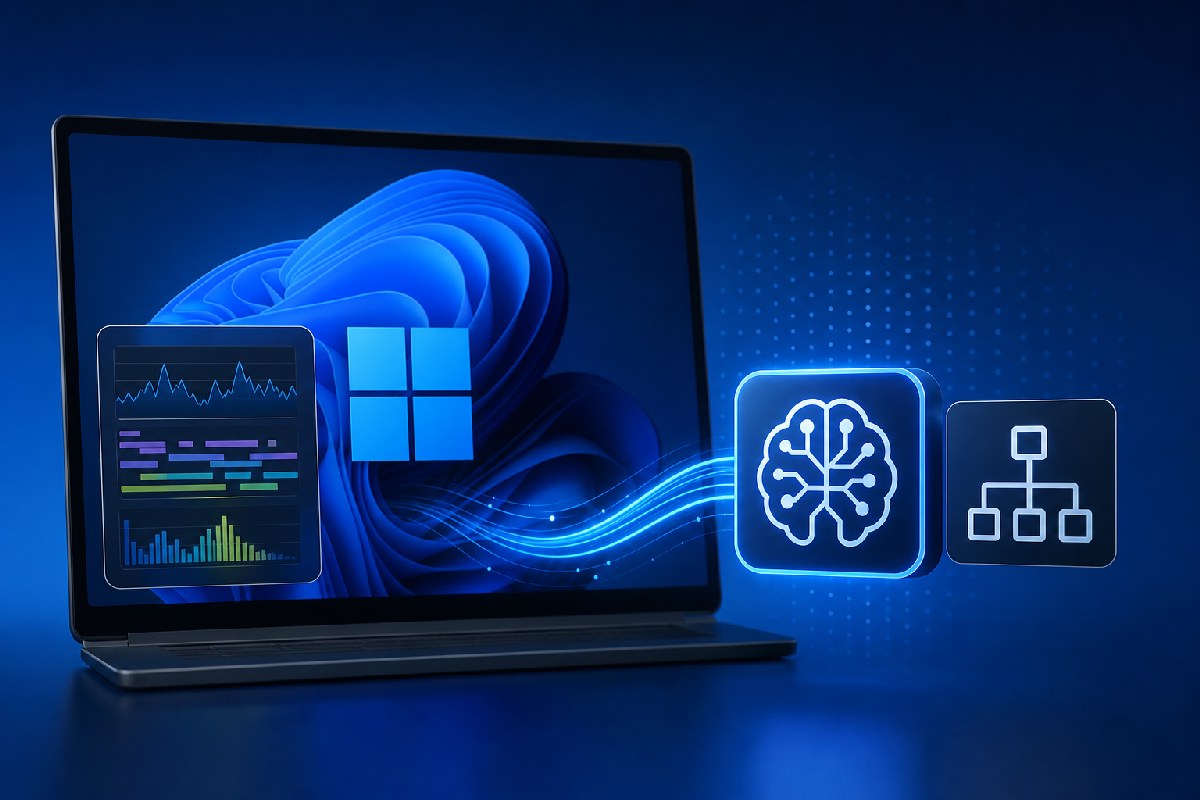
Microsoft is testing AI-assisted diagnostics across its Windows performance toolchain, aiming to make it faster to understand why a PC or workload slows down. Two pieces stand out in early previews: an AI bridge inside Windows Performance Analyzer (WPA) and a new, headless ETW MCP server that lets assistants like GitHub Copilot query Windows trace data in natural language.
This is aimed squarely at developers and partners who work with traces, not everyday users. The promise is less time wrestling with graphs, tables, and call stacks, and more time validating likely causes with evidence from the trace.
What Microsoft is testing
Windows Latest reports Microsoft is piloting an MCP integration directly in WPA, the company’s flagship tool for analyzing performance issues across CPU, disk, memory, scheduling, drivers, and more. With the MCP turned on, developers can use GitHub Copilot in the WPA workflow to ask focused questions like what caused a CPU spike or whether memory pressure or paging contributed to a slowdown. Microsoft cautions this is an early preview that currently supports GitHub Copilot only and requires an active subscription, and results can be incomplete or incorrect and must be verified.
In parallel, Neowin details a preview of ETW MCP, a Model Context Protocol server for Event Tracing for Windows (ETW). Instead of exposing raw events to a model, the server processes traces locally using Microsoft’s TraceProcessor engine and returns structured, read‑only results for the assistant to interpret. That design keeps the heavy data work on the client and lets the assistant base its guidance on actual trace outputs, with the option to request supporting evidence. ETW MCP is available as the Microsoft.Windows.EventTracing.MCP NuGet package.
How MCP changes the workflow
Model Context Protocol (MCP) connects an AI assistant to a tool’s capabilities. Here, it means:
- In WPA: natural‑language queries and summaries embedded in the familiar UI, with Copilot helping correlate data across views.
- With ETW MCP: terminal- and script‑friendly analysis for CI and headless environments, where assistants can answer trace questions without a GUI.
Neowin highlights current preview features on the ETW MCP side, including CPU usage analysis, process filtering and aggregation, multi‑trace comparisons, symbol‑aware investigations, Critical Path Analysis, and defining Regions of Interest to compare specific execution windows.
Why this matters for developers and IT
Performance analysis often bottlenecks on deep, specialized knowledge of traces and tooling. By letting assistants do the first pass—summarizing likely culprits such as CPU starvation, disk activity, memory pressure, paging, or drivers—engineers can focus on validation and fixes. For hardware and driver teams, this could accelerate investigations into CPU and power behavior. For app teams, it could streamline regression triage and shorten time-to-root-cause. And for organizations running automated testing, ETW MCP enables scripted trace analysis in pipelines.
Microsoft and its sources are clear on limits: AI-generated output is guidance, not ground truth. Findings should be verified against the underlying trace data before any decisions are made.
Status and what to watch
- WPA MCP: early preview, GitHub Copilot–only, requires subscription, and may produce incomplete or incorrect analysis that needs expert verification (Windows Latest).
- ETW MCP: preview available as the Microsoft.Windows.EventTracing.MCP NuGet package, with structured, read‑only access to processed trace information and support for headless use (Neowin).
Windows Latest also points to ongoing work to optimize RAM usage in Windows 11 and WinUI-based apps. Details beyond that are not covered in the reports.
If Microsoft can keep iterating here—expanding assistant support, hardening reliability, and deepening the integrations—these MCP bridges could meaningfully reduce the friction of Windows performance analysis without dumbing it down.
Sources: Windows Latest, Neowin.

Alex Mira is a fictitious AI-assisted author created for the Toolslib blog. Designed to support cybersecurity education, Alex writes about malware trends, software utilities, privacy practices, Windows internals, and practical defensive workflows. Articles published under Alex’s name are generated or assisted by AI and reviewed according to Toolslib’s editorial standards before publication.
Stay Updated with ToolsLib! 🚀
Join our community to receive the latest cybersecurity tips, software updates, and exclusive insights straight to your inbox!